.png)
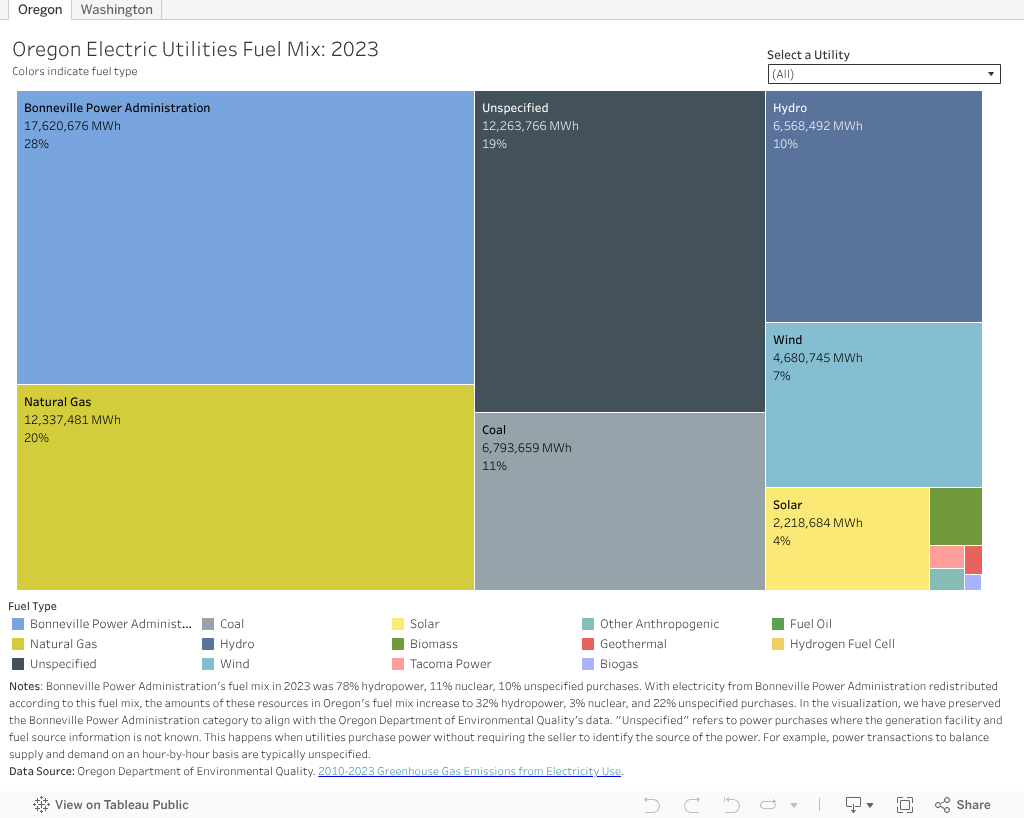
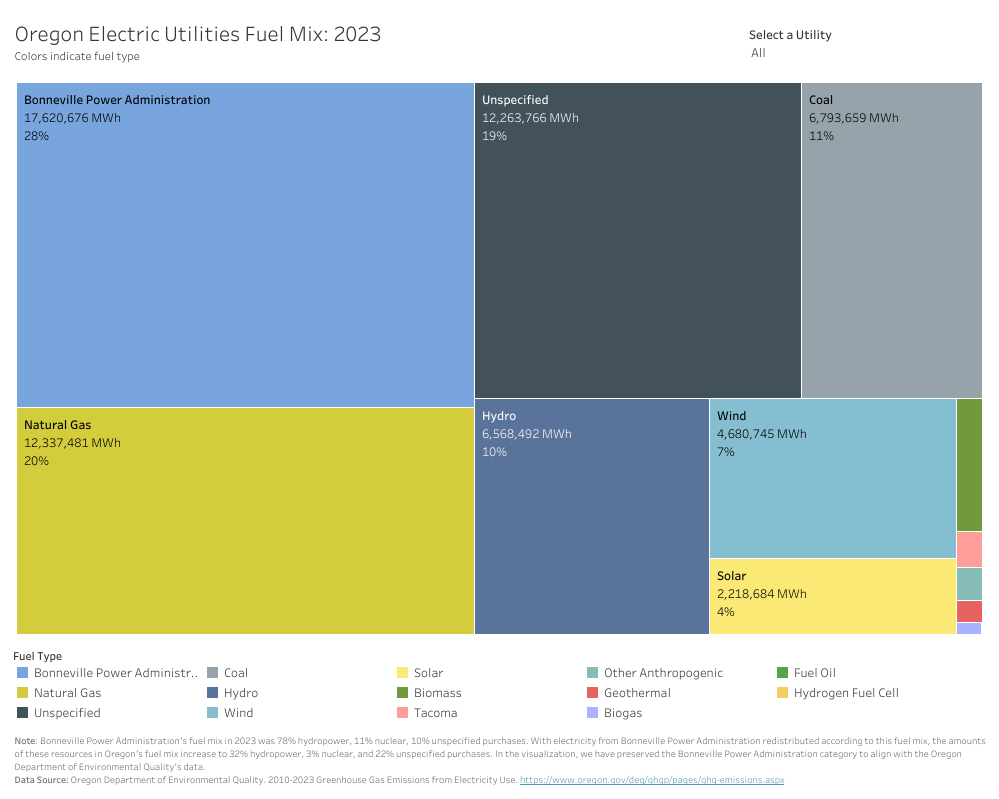
This visualization shows energy resources (often referred to as fuel mix) used to generate the electricity that Oregon and Washington utilities sold in 2023, both overall and by each individual electric utility.
Utilities in Oregon and Washington report their power coming from each type of resource. Oregon data distinguishes Bonneville Power Administration (BPA) as a resource, while Washington data allocates power from BPA to each resource (e.g., hydropower). Utilities in each state also report "unspecified" power, which is purchased from another utility and has an unknown source.
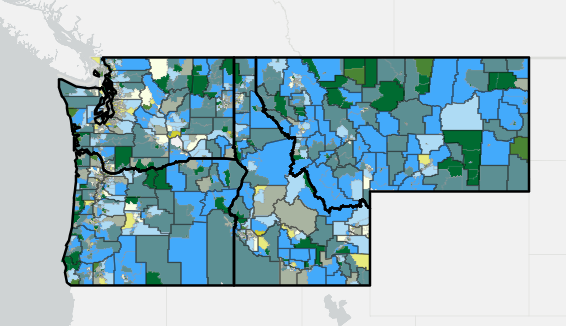
For more information about electricity generation in the Northwest states, see the Northwest Electricity Generation and Northwest Electricity Capacity maps. Learn more about each state's fuel mix in this blog.
Use the tabs above the visualization to toggle between Oregon and Washington utilities. Hover your mouse over the visualization to see exact data (especially for the smaller boxes) and click on each element for more options.
Filter by specific utilities using the menu on the right. Filter by resource type by clicking on it in the list below the visualization.

Click on the "reset" button (third from the left in the bottom right-hand toolbar) to return to the original view. To learn more about interacting with the visualizations, visit Tableau Tips.