.png)
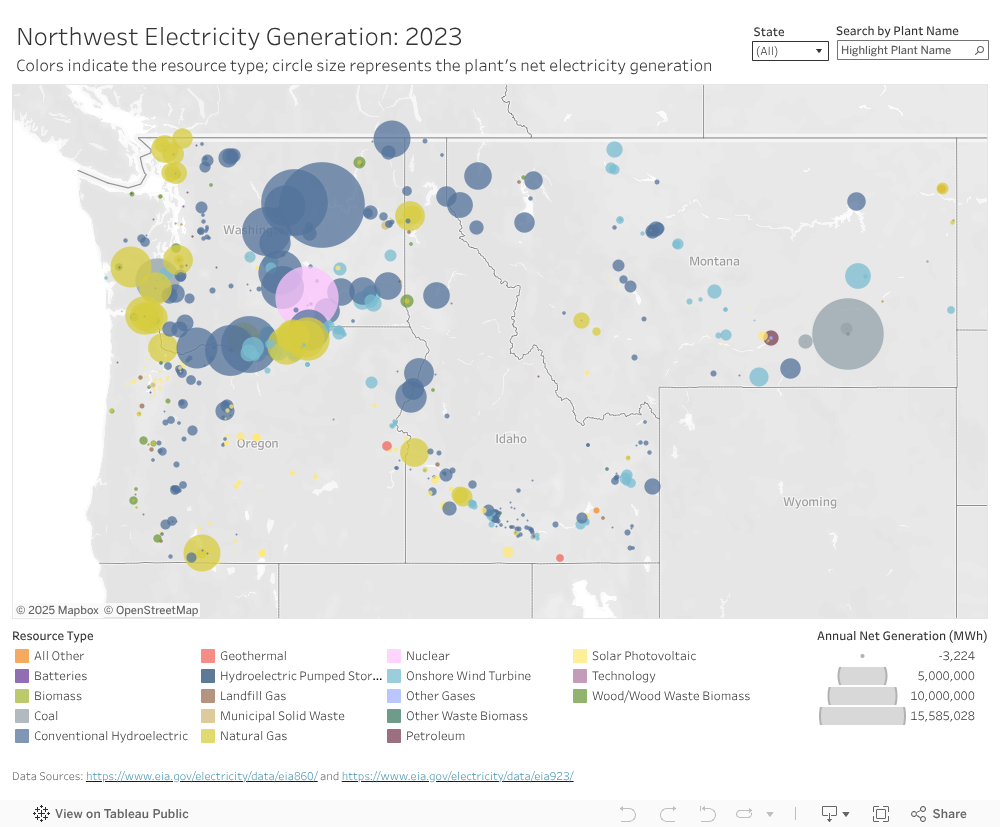
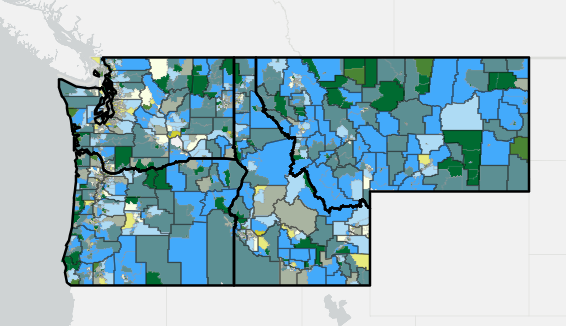
This visualization shows the annual net electricity generation in Northwest in 2023 and the energy resources used by each generator.
Hydroelectric power provides the largest share of electricity generation in the Northwest, though other resources such as natural gas and coal are also used. Hydroelectric power generation can fluctuate due to differences in annual snowpack and precipitation. When there is a shortfall in hydroelectric generation, natural gas fuel is typically used instead.
While the Northwest Electricity Capacity map shows the generator’s nameplate capacity, this visualization shows the net electricity that was actually produced by each of these generators in 2023, measured in megawatt hours (MWh). Net electricity generation can be negative if a resource consumes power but does not produce any energy, such as batteries.
Note: This visualization was updated on 8/21/2025. Previous versions of this visualization incorrectly calculated the annual net electricity generation for some plants. Please contact us if you have any questions.
Hover your mouse over the circles to see information about each generator and click for more options.

Click on the "reset" button (third from the left in the bottom right-hand toolbar) to return to the original view. To learn more about interacting with the visualizations, visit Tableau Tips.
Each circle on the map represents an electricity generator and is color-coded to show the resource type used. The circle size represents the annual net generation. Filter by resource type by clicking on it in the list below the map.
Note: Keep in mind that the scale adjusts when a filter is applied. The resulting scale is relative to the other elements within that filter and is shown in the legend on the right.