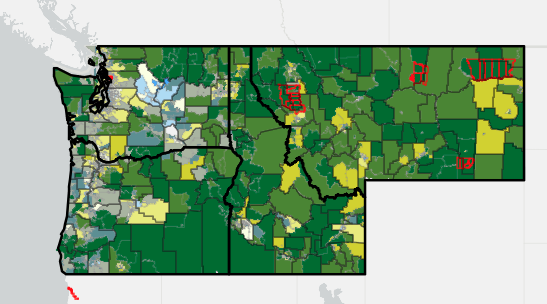
.png)
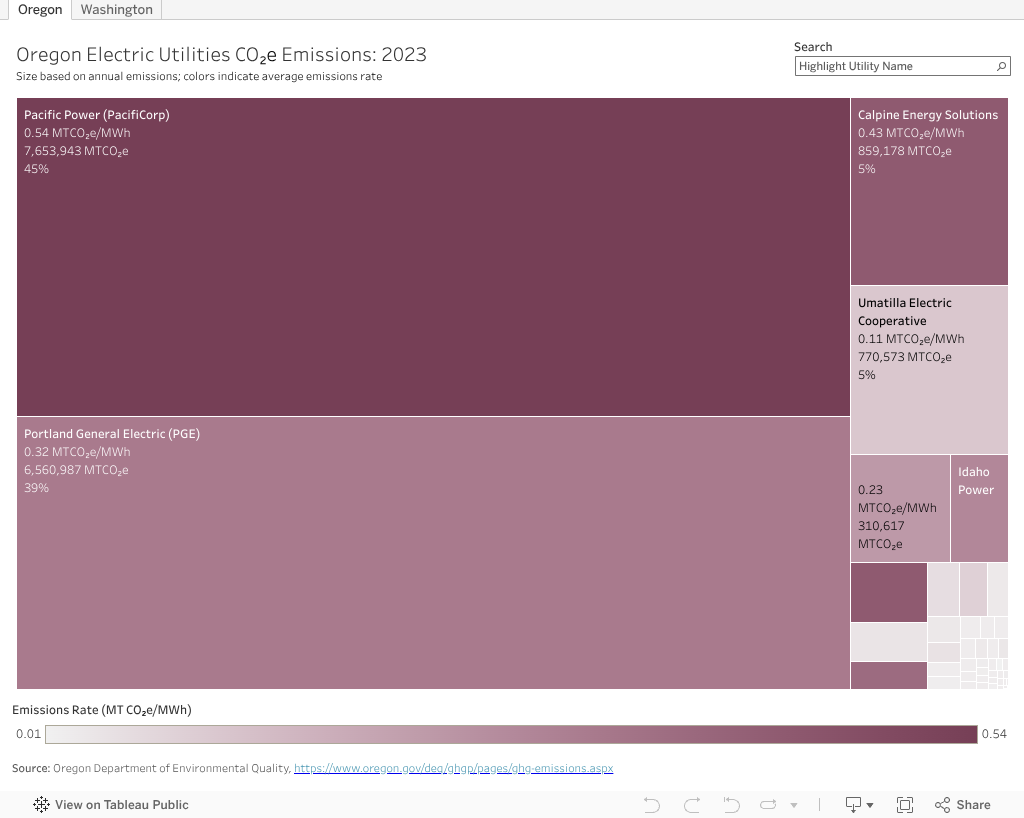
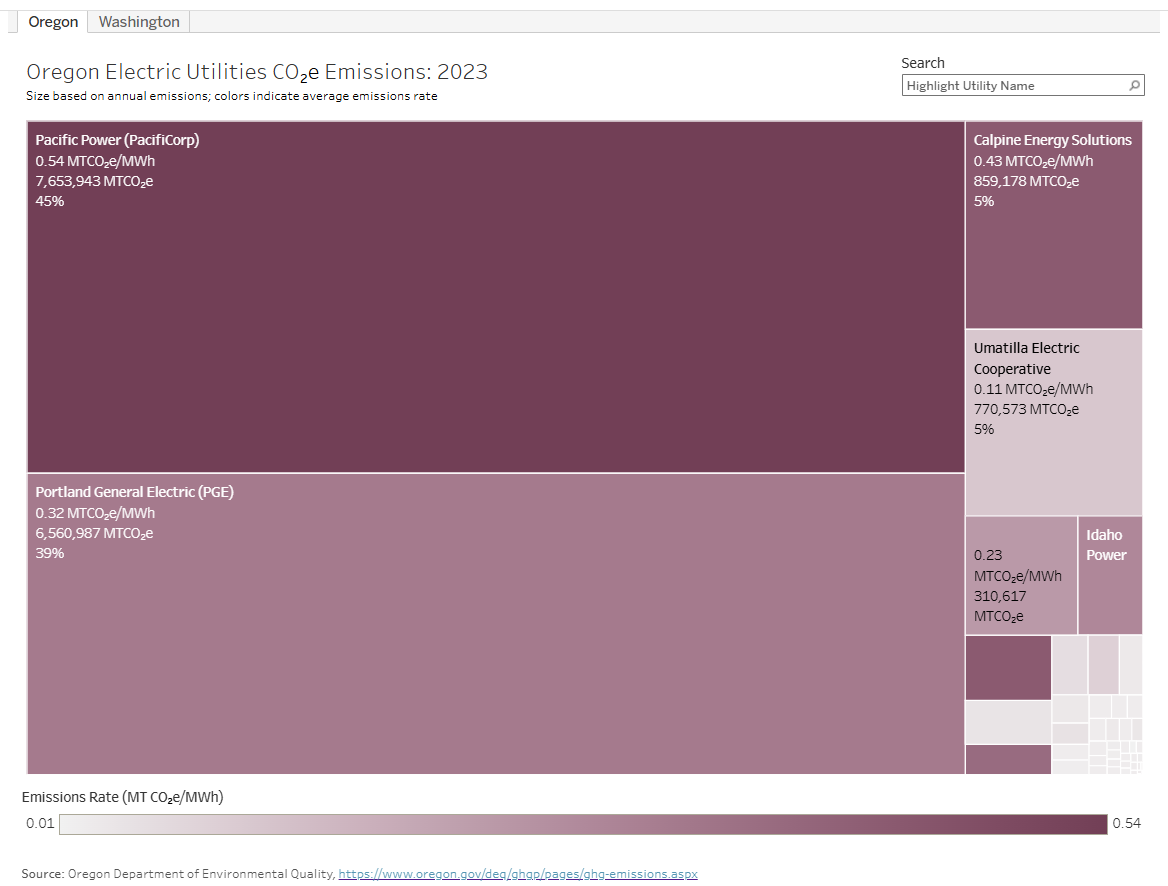
This visualization shows emissions from Oregon and Washington electric utilities in 2023 and 2022, respectively, by displaying both total annual emissions and average emissions rates.
Emissions from each of the utilities are shown as shares of the total annual emissions by electric utilities in each state. For utilities that also provide service in neighboring states, such as Avista and Pacific Power, only the share of emissions from each state's customers is shown.
A utility’s emissions rate is based on how much CO₂ is emitted during the production of 1 MWh electricity. The annual emissions depend on the emissions rate as well as the total electricity sold and customers served. When comparing one utility to another, it is possible that one might have higher annual emissions yet a lower emissions rate (e.g., in Washington, Puget Sound Energy compared to Pacific Power).
Learn more about each state's electric utility emissions in this blog.
Use the tabs above the visualization to toggle between Oregon and Washington utilities. Hover your mouse over the visualization to see exact data (especially for the smaller boxes) and click on each element for more options. Highlight a specific utility by using the search box in the upper righthand corner.
The box size corresponds to the utility’s total annual emissions, and the color indicates its emissions rate (CO₂ lbs / MWh).

Click on the "reset" button (third from the left in the bottom right-hand toolbar) to return to the original view. To learn more about interacting with the visualizations, visit Tableau Tips.