.png)
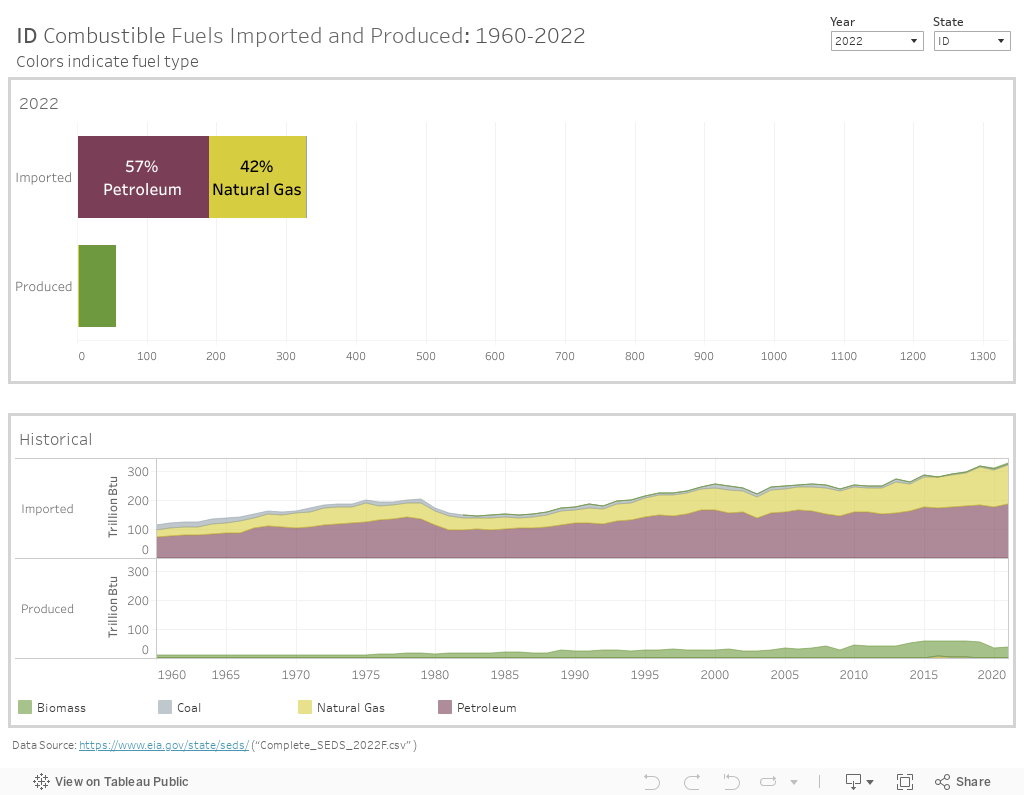
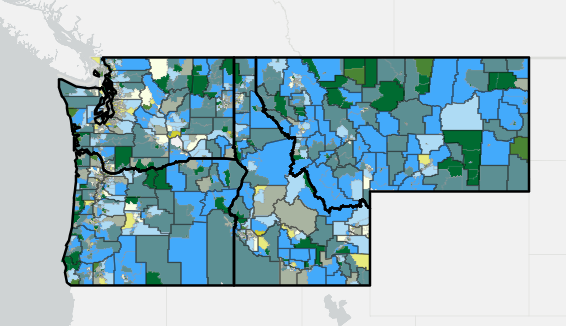
This visualization shows how much biomass, coal, natural gas, and petroleum are imported versus produced in the Northwest states, both historically since 1960 (lower visualization) and in 2022 (upper visualization). Note that the 2020 data reflect COVID-19’s impact on energy use and consumption.
Notice that Montana stands out as a major producer of combustible fuels, mostly due to its coal production, while Washington, Idaho and Oregon import a large portion of the combustible fuels they consume.
Hover your mouse over the visualization to see exact data and click on each element for more options.

Click on the "reset" button (third from the left in the bottom right-hand toolbar) to return to the original view. To learn more about interacting with the visualizations, visit Tableau Tips.
Filter the upper visualization by year (1960-2022) and/or filter both visualizations by state (ID, MT, OR, WA) by using the dropdown menus in the upper righthand corner.
For additional analysis of the energy use for each of the four Northwest states, including a side-by-side comparison of energy resources produced in each state, please see here.