.png)
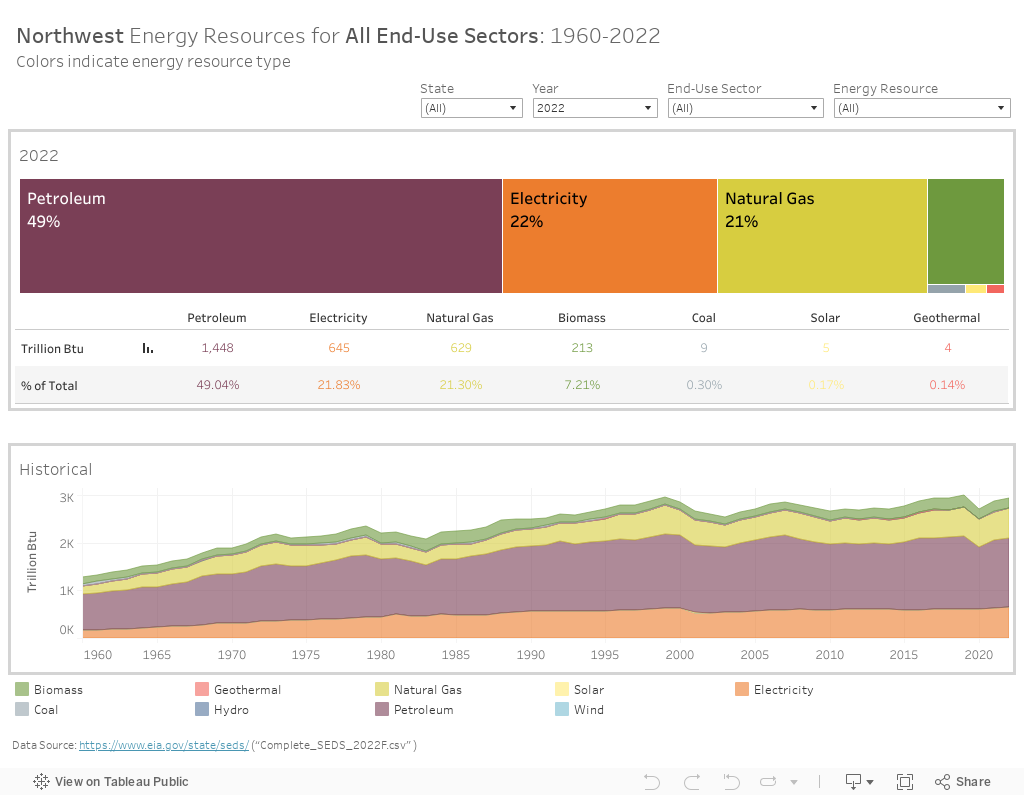
This visualization shows energy resources for direct use in the Northwest and for all states individually, as well as for all end-uses and by end-use sector. Data for 2022 are displayed in the upper visualization, while historical data since 1960 are shown in the lower visualization. Note that the 2020 data reflect COVID-19’s impact on energy use and consumption.
The commercial, industrial, residential, and transportation end-use sectors in the Northwest directly use energy derived from petroleum, electricity, natural gas, biomass, coal, solar, and geothermal.
This visualization does not include the resources used to produce electricity used in each end-use sector (see Northwest Energy Resources Used to Produce Electricity to explore those data). For example, wind and solar energy are primarily used to produce electricity in the Northwest, with only a small percentage of solar energy used directly for space and water heating in buildings. The Northwest Wind and Solar Generation visualization provides a more detailed exploration of wind and solar energy.
Hover your mouse over the visualization to see exact data and click on each element for more options.

Click on the "reset" button (third from the left in the bottom right-hand toolbar) to return to the original view. To learn more about interacting with the visualizations, visit Tableau Tips.
Filter by state (ID, MT, OR, WA); year (1960-2022); end-use sector (All, Commercial, Industrial, Residential, Transportation); and/or energy resource by using the dropdown menus in the upper right-hand corner.
Toggle through the filters to compare energy usage among sectors and states.
For additional comparative analysis of the energy use for each of the four Northwest states, please see here.