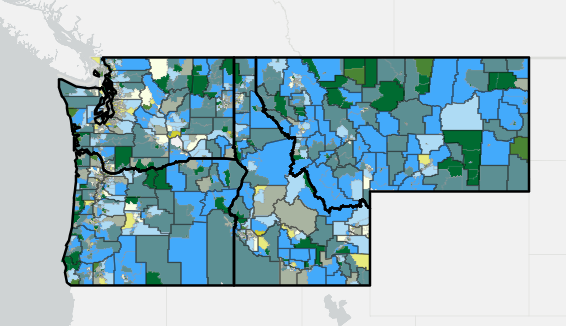
.png)
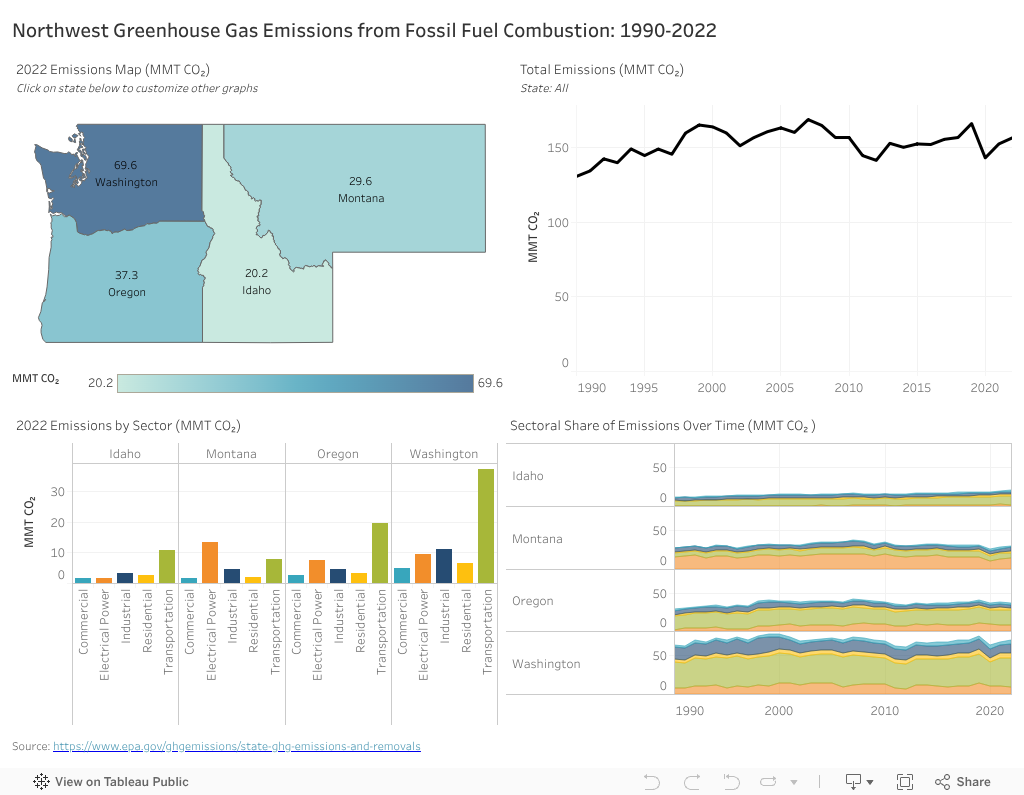
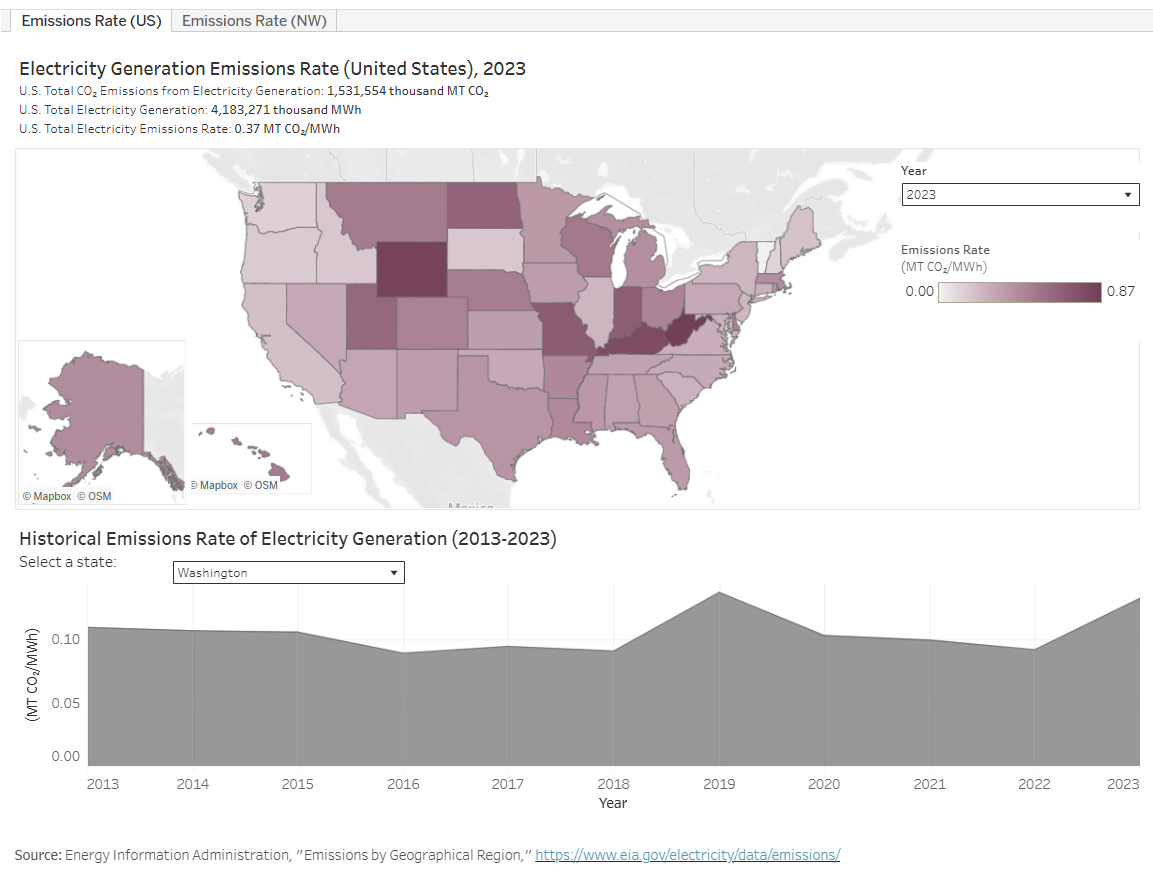
This visualization shows greenhouse gas emissions from fossil fuel combustion in the Northwest, with 2022 emissions for each state shown in the map in the upper left. Additional graphs show emissions by sector in 2022 and total emissions and sectoral greenhouse gas emissions from 1990 to 2022.
The three highest emitting sectors in the Northwest are transportation, electric power, and industrial. The transportation sector burns petroleum, diesel, and gasoline. Electric power emissions include those from the combustion of fossil fuels, such as coal and natural gas, for electricity generation. In this visualization, emissions from production of electricity are only counted in the electric power sector, rather than the end-use sector that uses the electricity, and are counted in the state that produces the electricity (rather than the one in which electricity is consumed). The industrial sector includes fossil fuels burned in manufacturing, mining, refining, and other industrial processes.
In every state except Montana, the transportation sector is responsible for most of the greenhouse gas emissions. In Montana, electric power is the use sector with the highest emissions because coal is used for the majority of the state's electricity generation.
Note: This visualization uses net emissions data from the Inventory of U.S. Greenhouse Gas Emissions and Sinks by State, which was first published by the U.S. Environmental Protection Agency (EPA) in March 2022. Previous versions of this Atlas visualization used the EPA's State CO2 Emissions from Fossil Fuel Combustion data, which is not updated beyond 2018. There may be differences between the EPA's state-level estimates and independent state greenhouse gas inventories. Read more about the different methodologies here.
Click on a state from the map to filter the other graphs by that state. Hover your mouse over elements of the visualization to see exact data.

Click on the "reset" button (third from the left in the bottom right-hand toolbar) to return to the original view. To learn more about interacting with the visualizations, visit Tableau Tips.