.png)
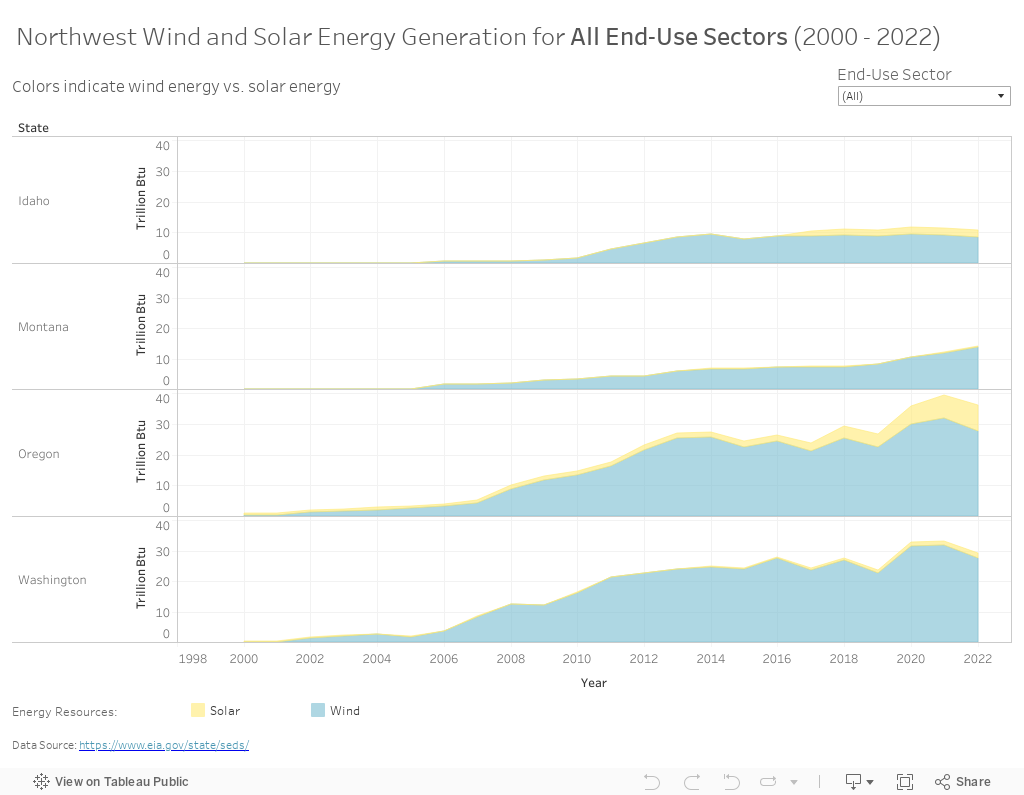
This visualization shows wind and solar energy generation in the four Northwest states from 2000-2022.
In the Northwest, wind energy generation has increased significantly more than solar energy generation since the early 2000s. When filtering for solar energy alone, though, it is possible to see increased production, especially in Idaho and Oregon.
Wind energy is used solely for electricity production, while solar energy is used both to produce electricity for the grid as well as for some onsite residential, commercial, and industrial uses. The Northwest Energy Resources and Uses visualization shows more details on the small percentage of solar energy that is used directly (i.e., not to produce electricity) in end-use sectors.
Note: This visualization relies on data from the Energy Information Administration (EIA). In 2023, the EIA updated the way they calculate energy consumption of electricity generation from noncombustible renewable energy sources (including solar and wind). The EIA now uses the captured energy approach, rather than the fossil fuel equivalency approach. Previous versions of this visualization reflected the old EIA methodology. Read more here.
Hover your mouse over the visualization to see exact data and click on each element for more options.

Click on the "reset" button (third from the left in the bottom right-hand toolbar) to return to the original view. To learn more about interacting with the visualizations, visit Tableau Tips.
Filter by use sector (All, Commercial, Electricity, Industrial, and Residential) by using the dropdown menu in the upper right-hand corner. Note: Filtering for Transportation will not produce a visualization because wind and solar energy are not used directly in the Transportation sector.
For additional comparative analysis of the energy use for each of the four Northwest states, please see here.