.png)
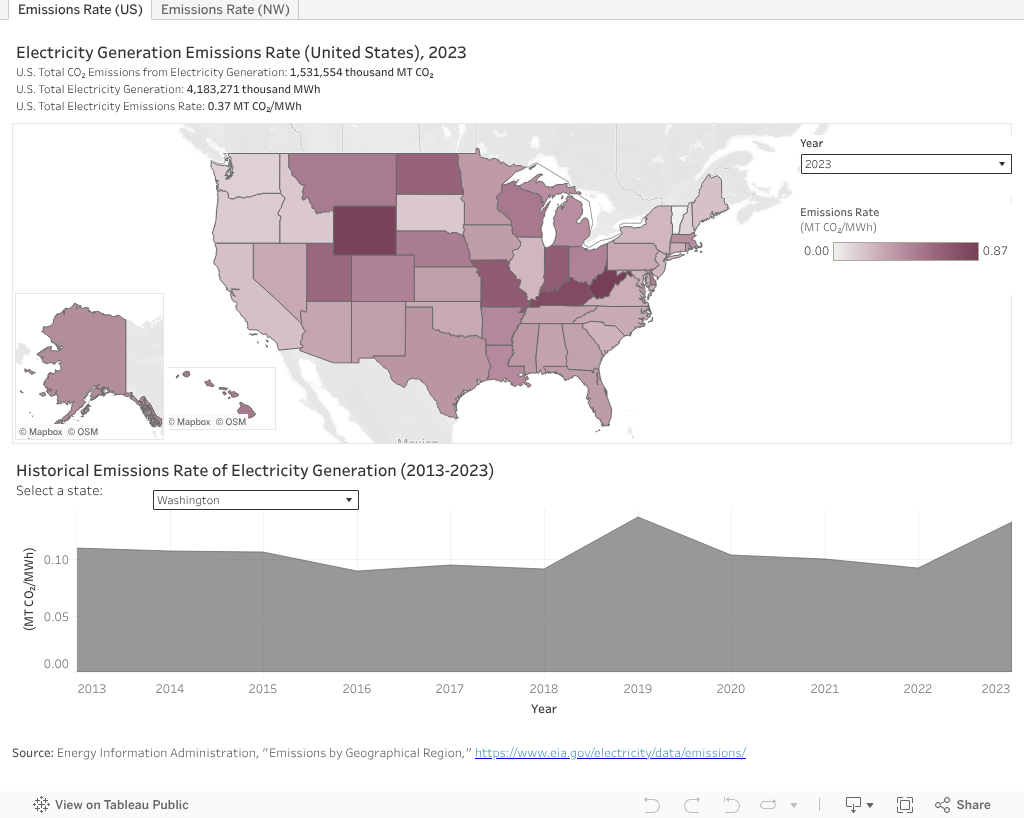
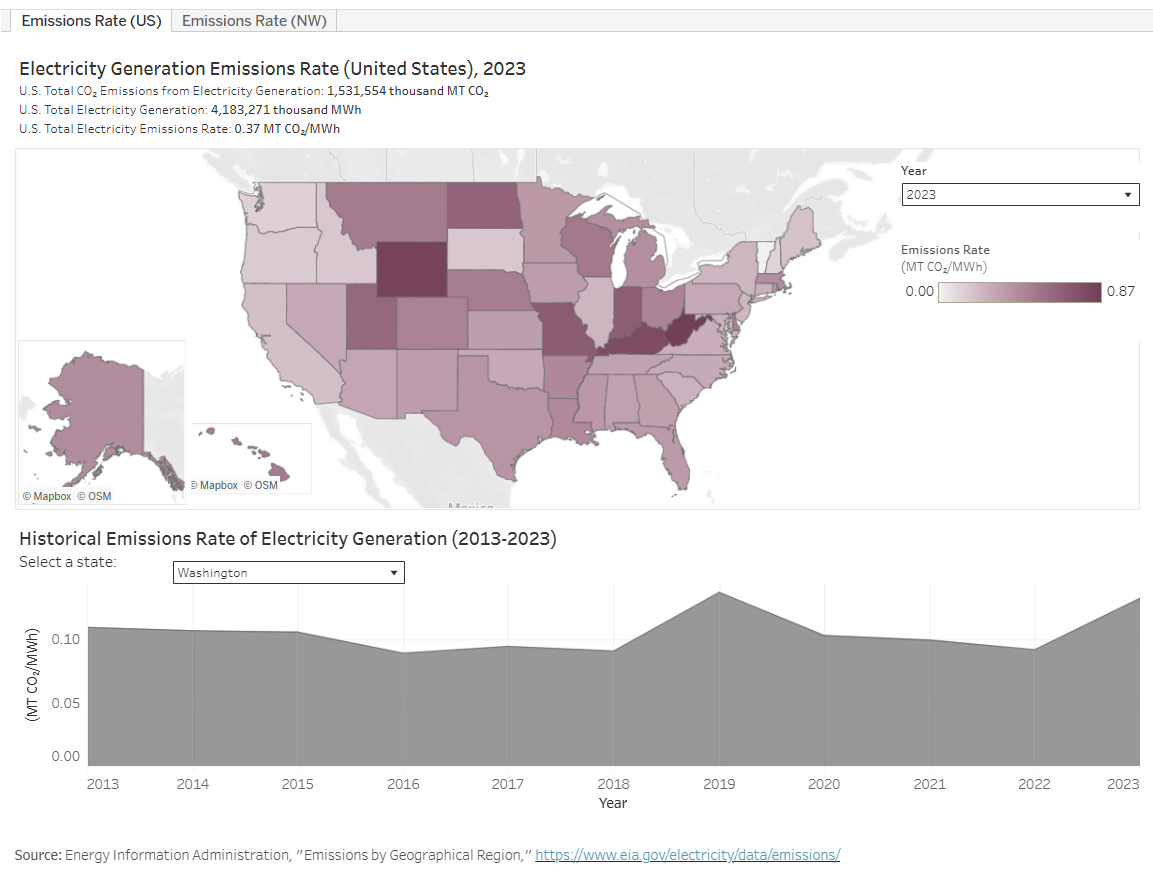
This visualization shows the emissions rate of electricity generation in the United States from 2013 to 2023. Emissions rate refers to the amount of greenhouse gases emitted per unit of electricity produced, in this case shown as metric tons (MT) CO2 per megawatt-hour (MWh).
The upper visualization displays annual emissions rate data by state, while the lower visualization traces the historical changes in carbon intensity from 2013 to 2023 in the U.S. and in each state. Note that the 2020 data reflect COVID-19’s impact on energy use and consumption.
Overall, the emissions rate of electricity generation in the U.S. has steadily decreased from 2013 (0.53 MT CO₂/MWh) to 2019 (0.37 MT CO₂/MWh), with exact changes varying by state.
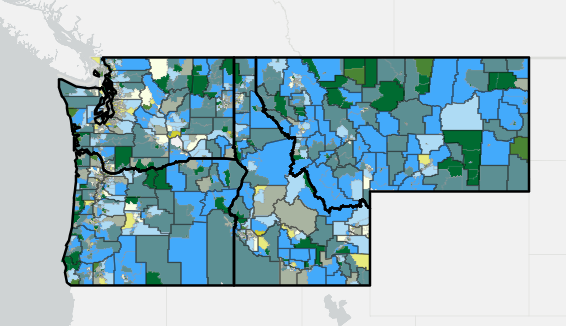
For example, when filtering for Washington state, the electricity generation emissions rate jumps from 2018 (0.09 MT CO₂/MWh) to 2019 (0.14 MT CO₂/MWh), then ratchets down in 2020 (0.1 MT CO₂/MWh). The increase in 2019 indicates a lower use of clean hydropower and an increased use of carbon-intensive thermal energy such as natural gas. Hydropower and thermal energy use typically vary inversely from year to year in the Northwest.
For more on electricity in the Northwest, visit Northwest Energy Resources Used to Produce Electricity, Northwest Electricity Generation, and Northwest Electricity Capacity. You can also visit the Utilities category to explore electric utilities in Oregon and Washington in more detail.
Hover your mouse over the visualization to see exact data such as emissions rate and year-over-year change and click on each element for more options.

Click on the "reset" button (third from the left in the bottom right-hand toolbar) to return to the original view. To learn more about interacting with the visualizations, visit Tableau Tips.
Use the tabs above the visualization to toggle between the United States and the Northwest. For the map, filter by year (2013-2023) using the dropdown menu. For the lower historical visualization, use the dropdown menu to select a state.