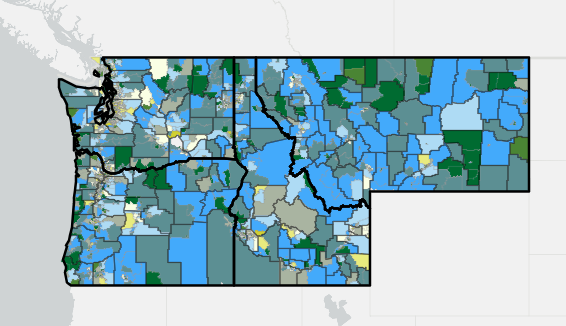
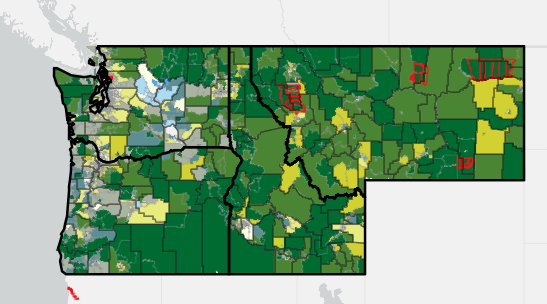
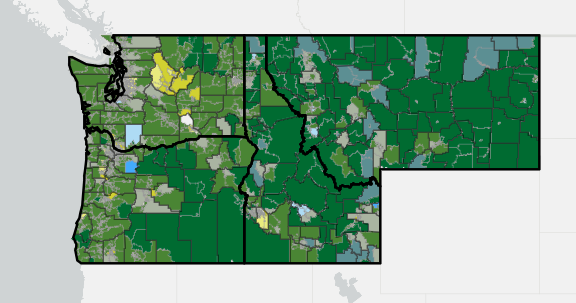
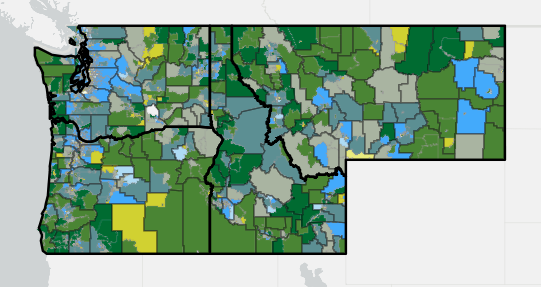
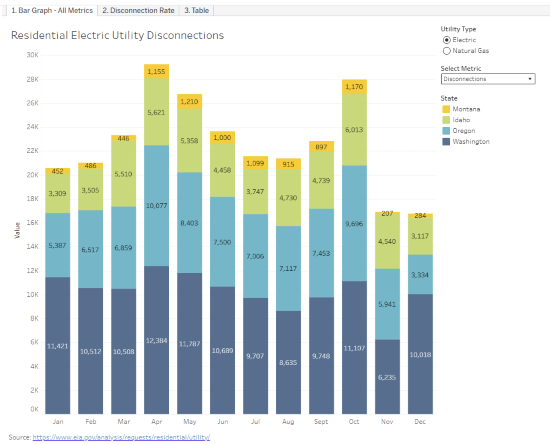
This visualization shows data from electric and natural gas utilities on monthly final notices, disconnections, and reconnections for residential customers due to bill nonpayment (arrearages) for calendar year 2024. Read more about the data on this blog.
The first tab shows residential utility disconnections, final notices, or reconnections, depending on the metric selected. Disconnections are typically lower in the colder months (approximately November – March) due to the customer protections that exist, and disconnections peak in the months directly succeeding and preceding these winter months (April and October).
The second tab shows the residential utility disconnection rate, which is calculated as the annual sum of disconnections divided by the number of residential customers. Idaho has the highest electric utility disconnection rate in the Northwest, at 6.4%, while Montana has the lowest at 2.2%. The natural gas disconnection rates have a smaller range, from 0.6% (Washington) to 1.5% (Oregon). The disconnection rate for each of the four Northwest states is lower than the national average disconnection rate for electric utilities (9.4%) and natural gas utilities (2.2%).
Lastly, the third tab provides a table with summarized data, with the ability to filter the view to see these numbers by month and each individual utility using the dropdown menus at the top. Following the data in one column from top to bottom helps paint the picture from total residential customers to number of final notices received to number of disconnections ultimately executed, presented as a percent (disconnection rate) as well. Then there are the number of reconnections, and finally the percent that were never reconnected in 2024.
Note: Several utilities, including one in Idaho and two in Oregon, were flagged by the Energy Equity Project as having bad or incomplete 2024 reporting. For detail, see datasheet linked on the Tsunami of Shutoffs website.
Hover your mouse over the visualization to see exact dataand click on each element for more options.
Filter by utility type, metric, or utility name using thedropdown menus in the top right.

Click on the "reset" button (third from the left in the bottom right-hand toolbar) to return to the original view. To learn more about interacting with the visualizations, visit Tableau Tips.