.png)
Data Sources: 2018-2022 American Community Survey and the U.S. DOE’s Low-Income Energy Affordability Data (LEAD) Tool, accessed 9/3/2024
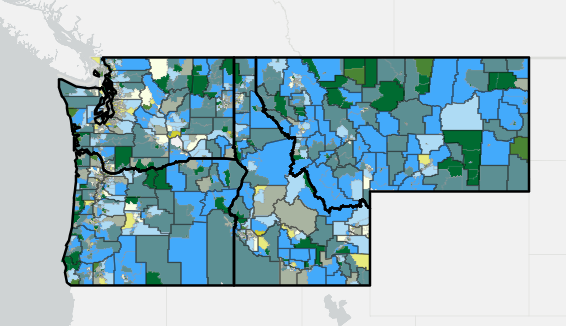
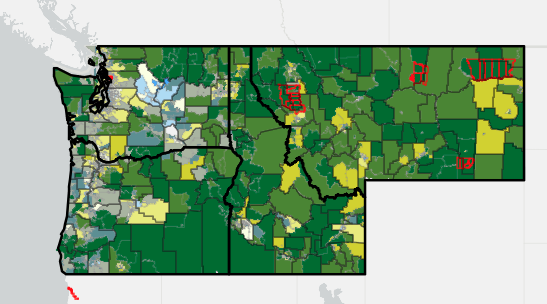
When considering equitable building decarbonization for rural and Tribal communities, it’s imperative to examine not only the affordability, but also the quality of the housing stock.
This map shows the percentage of households living in manufactured housing paired with average energy burden (the percentage of annual household income spent on energy costs). Manufactured housing, also known as mobile homes, refers to prefabricated homes designed to be transportable. This housing tends to be less energy efficient due to limited insulation, older windows, and outdated appliances.
Many families struggle to secure safe and affordable housing in rural communities. Homeowners are far more likely to be unable to afford housing repairs, let alone energy efficiency upgrades. The housing stock in rural and Tribal communities also tends to include more manufactured homes. For example, the median for rural communities inhabiting manufactured homes in Washington state is 13% of residents versus 1.5% in urban communities.
In Northwestern communities with more than 10% of residents living in manufactured homes, the median energy burden is 6%, whereas the median energy burden is 4% for Northwestern communities with fewer than 10% of members in manufactured housing. This means that a family making the median household income in 2022 in the United States ($74,580) and living in a community where more than 10% of residents live in manufactured homes could pay roughly $4,475 annually on energy bills, while someone living in a community with fewer residents living in manufactured homes might expect to pay roughly $2,983 annually.
Click on the "i" in the upper left-hand corner to open the map legend. Use the options in the lower right-hand corner to open in ArcGIS map viewer, view in full screen, search for an address, return to the default zoom view, and zoom in and out. Click on the map to see associated data.
The map is divided into census tracts, which are color-coded to show the community-level relationship between the percentage of households living in manufactured housing and average energy burden. Black lines indicate counties and red lines indicate Tribal Lands.
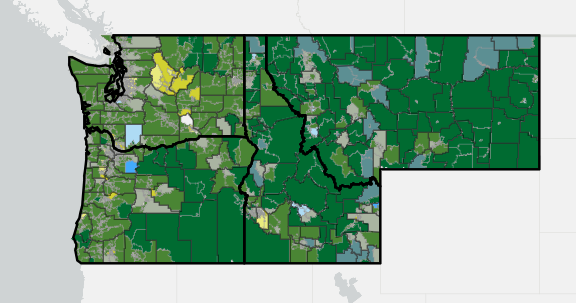
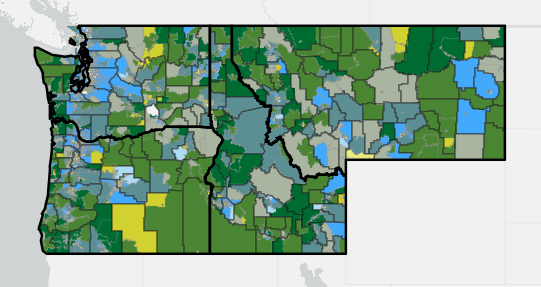
The darkest green (top center square in the legend) indicates communities with both high percentages of households living in manufactured housing and high average energy burden.
The blue (right corner square) indicates communities with high energy burden but low percentages of households living in manufactured housing, while the light green (left corner square) shows communities with low percentages of households living in manufactured housing but high energy burden.
Lastly, the light yellow (bottom center square) shows areas that have both low percentages of households living in manufactured housing and low average energy burden.
Note: The white area between Yakima County and Franklin County is Hanford, a decommissioned nuclear production site where no one is permitted to live within 35 miles.