.png)
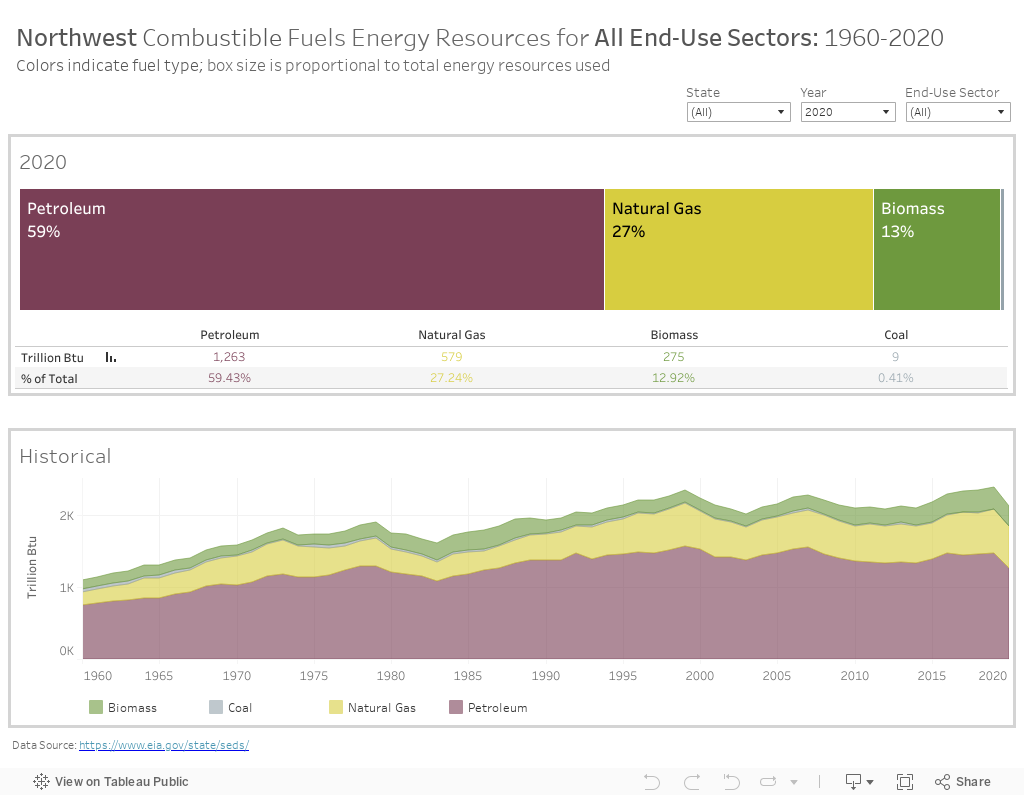
This visualization focuses on the combustible fuels used directly in end-use sectors in the Northwest, both historically since 1960 (lower visualization) and in 2020 (upper visualization). Note that the 2020 data reflect COVID-19’s impact on energy use and consumption.
Like the previous visualization, this visualization explores energy resources used directly in each end-use sector and does not include resources used to produce electricity used in each end-use sector. See Northwest Energy Resources Used to Produce Electricity to explore those data.
Hover your mouse over the visualization to see exact figures and click on each element for more options.

Click on the "reset" button (fourth from the right in the bottom right-hand toolbar) to return to the original view. To learn about interacting with the visualizations, visit Tableau Tips.
Filter by state (ID, MT, OR, WA); year (1960-2020); and/or end-use sector (All, Commercial, Industrial, Residential, Transportation) by using the dropdown menus in the upper right-hand corner.
Toggle through the filters to compare energy usage among sectors and states.
For additional comparative analysis of the energy use for each of the four Northwest states, please see here.


