.png)

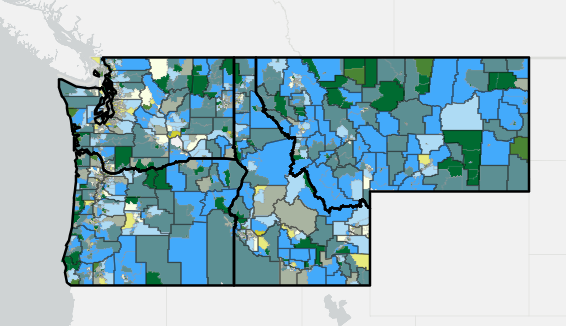
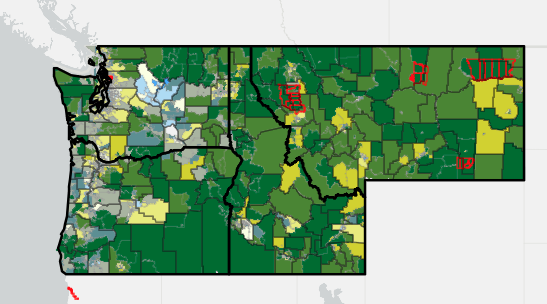
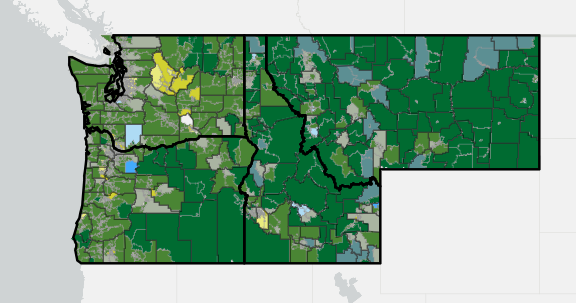
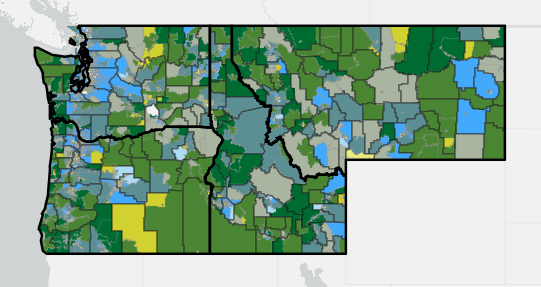
This visualization shows the location and electricity generation capacity of electricity generators in the Northwest in 2023 and the energy resources used by each facility.
Electricity generation capacity is the potential electricity that can be produced by a generator. In this visualization, capacity is based on the generator’s nameplate capacity as determined by its manufacturer and is measured in megawatts (MW).
The Northwest Electricity Generation map shows the electricity that is actually produced, measured in megawatt hours (MWh).
Hover your mouse over the circles to see information about each generator and click for more options.

Click on the "reset" button (third from the left in the bottom right-hand toolbar) to return to the original view. To learn more about interacting with the visualizations, visit Tableau Tips.
Each circle on the map represents an electricity generator and is color-coded to show the resource type used. The circle size represents the generator’s nameplate capacity. Filter by resource type by clicking on it in the list below the map.
Note: Keep in mind that the scale adjusts when a filter is applied. The resulting scale is relative to the other elements within that filter and is shown in the legend on the right.