.png)
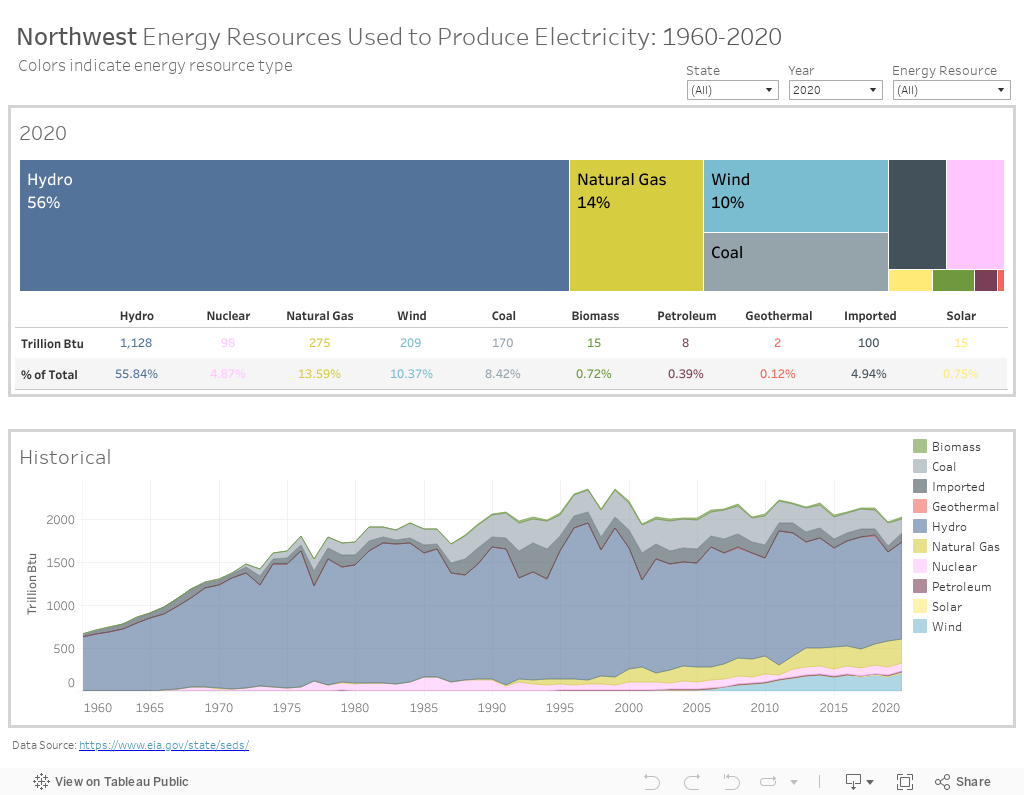
This visualization shows the energy resources used to produce electricity in the Northwest, both historically since 1960 (lower visualization) and in 2020 (upper visualization). Note that the 2020 data reflect COVID-19’s impact on energy use and consumption.
The lower visualization traces historical changes in resources used to produce electricity. It shows the emergence of renewable energy resources that join hydroelectricity—biomass, wind, and solar—over the past 20 years. The lower visualization also reveals the decrease of coal and the dominance of hydroelectricity. The Northwest Electricity Generation visualization provides a map of where electricity is generated in the region.
Hover your mouse over the visualization to see exact figures and click on each element for more options.

Click on the "reset" button (fourth from the right in the bottom right-hand toolbar) to return to the original view. To learn about interacting with the visualizations, visit Tableau Tips.
Filter by state (ID, MT, OR, WA); year (1960-2020); and/or energy resource by using the dropdown menus in the upper right-hand corner.
For additional comparative analysis of the energy use for each of the four Northwest states, including a side-by-side comparison of electricity production in each state, please see here.


